CLIMATE CHANGE, FIRES, AND HUMAN HEALTH
|
Climate Smart Missoula is science based. We care about people, fish, wildlife, and our natural landscapes! Climate change affects all these and more, whether through direct impacts like changes in temperature or snowfall, or indirect impacts like changes to an individual species' behavior or health. The science behind increasing wildfire in the western US due to climate change is robust. There is also a growing body of research on the health impacts of wildfire smoke.
|
Keep in Mind... Wildfires are naturally occurring forces of change in Montana and across the west. Not every fire is bad. Some forest types are particularly adapted to fire. It's complicated! Read more HERE. |
CLIMATE CHANGE IN MONTANA
|
In 2021, a group of partners released CLIMATE CHANGE AND HUMAN HEALTH IN MONTANA -- a special report of the Montana Climate Assessment. You can download the full report HERE. See chapter 3 in particular! Key findings and more options at montanaclimate.org. |
In September 2017, a statewide team of scientists released the first Montana Climate Assessment report - an excellent, detailed look at the ways our climate has changed and projections for the future, with a particular focus on impacts to agriculture, forestry, and water. Future reports will focus on other industries, including recreation and tourism.
The impacts of climate change can be hard to see and understand. Analyzing long-term trends and comparing historical conditions to current data tells us how our climate is changing. These long-term trends also influence the short-term variability of our weather from day to day and year to year. In Montana, we’ve already seen changes in our temperature and precipitation patterns. |
RISING TEMPERATURES
Rising temperatures correspond with the growing amount of CO2 in our atmosphere. The greenhouse effect allows CO2 to build up and trap heat around the earth, causing global temperature increases and other climate effects. Across Montana, we've experienced this firsthand. Average annual temperatures have risen between 2 and 3 degrees Fahrenheit since 1950, with the greatest warming occurring during winter and spring. Higher winter and spring temperatures mean less snowpack and earlier snowmelt, often causing dry late summer conditions.
|
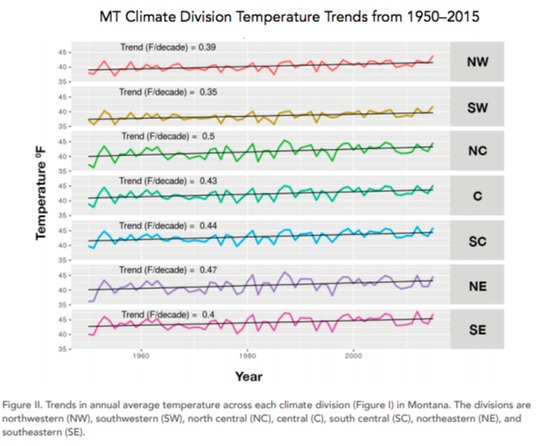
Average temperatures have increased in all regions of Montana. The trend lines in the graph to the left show average temperature change per decade. Each region has seen increases.
Graph from the 2017 Montana Climate Assessment. Warmer springs mean early snowmelt. With winter snowpack melting early, forests and streams have less water during late summer. Various ecosystems, wildlife, and agricultural practices are all impacted by reduced streamflow and less soil moisture. Summer temperatures are hotter, too. Average June through August temperatures in Montana over the period 2000 – 2018 were 1.5 degrees hotter than the 20th century average. One and a half degrees may not seem like much, but even a small temperature increase can have significant effects. |
|
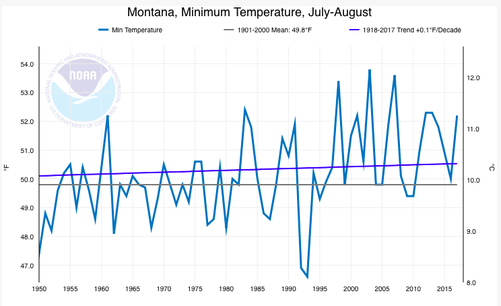
Minimum and maximum temperatures are increasing as well. We are experiencing longer, hotter days, and less respite from the heat overnight. Public health officials warn that hotter nights can make heat waves even more dangerous. The upward sloping line on the graph to the right shows the trend of warmer average minimum temperatures during the summer. To look at more temperature data and graphs, visit the NOAA Climate At A Glance webpage. |
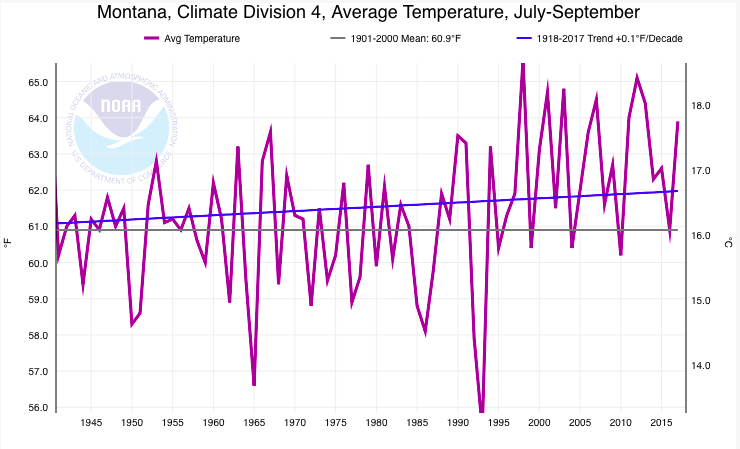
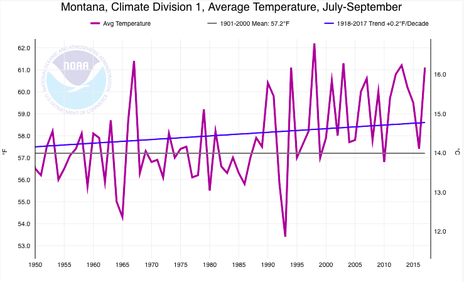
During summer months, heat waves can be more intense. In July through September, for example, average temperatures have been steadily increasing over the last 60 years. (See the blue trend line in the graphs below. Left are temperatures trends for Central Montana, right are trends for Western Montana.)
PRECIPITATION
Global temperature changes also impact precipitation patterns. In Montana, climate change is projected to increase precipitation in winter and spring months, but decrease during summer. Paired with higher summer temperatures and early snowmelt, less summer precipitation means that drought is more likely. According to the 2017 Montana Climate Assessment, the largest decreases in summer precipitation are expected to occur in the central and southern parts of the state.
WILDFIRES AND AIR QUALITY
|
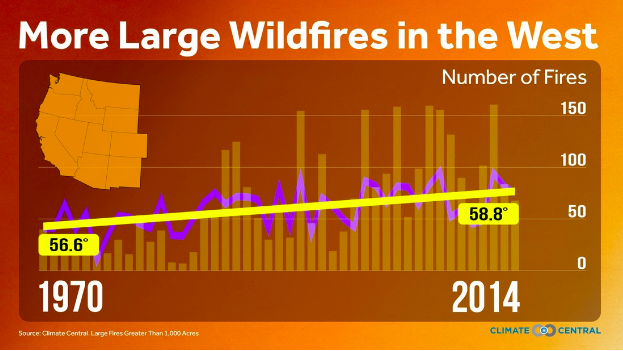
Hotter temperatures and earlier snowmelt contribute to dry conditions that fuel wildfires. Here in the West, alongside increasing temperatures, the average annual number of large wildfires (fires over 1000 acres) has more than doubled since 1970, and the general "wildfire season" in some years is months longer. This trend is particularly extreme in the Northern Rockies, where large wildfires are 10 times more common and the area burned is up to 45 times greater.
The graph on the right shows the annual number of fires (vertical bars) alongside the annual average temperature (purple line). |
The above graphic was taken from the Climate Central website.
|
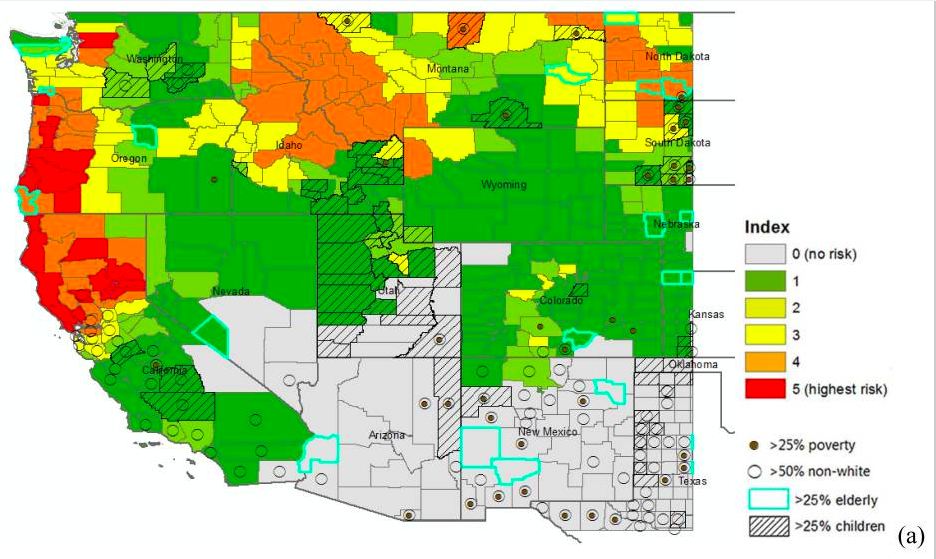
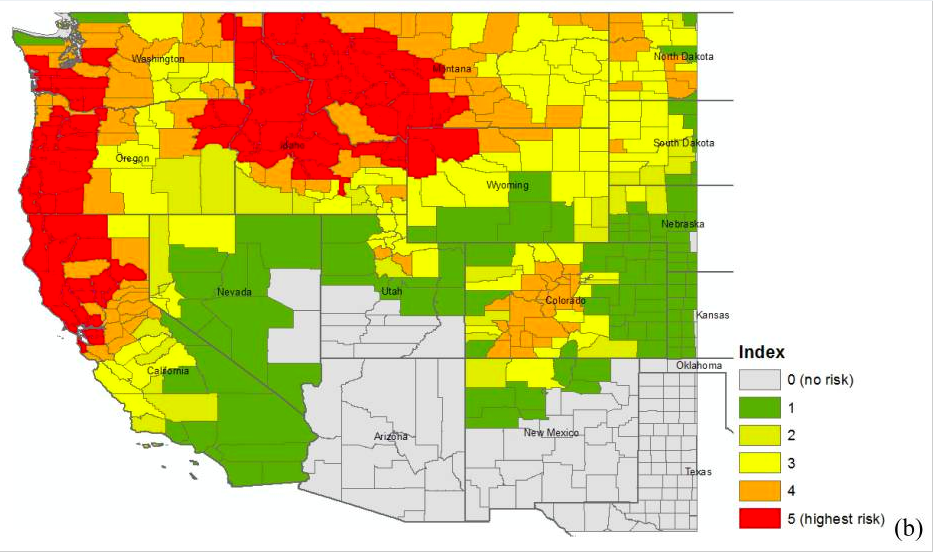
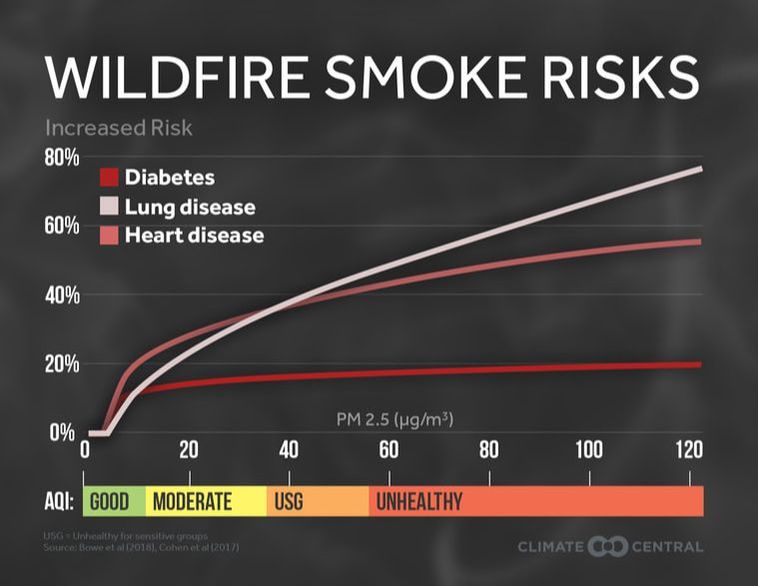
In much of Western Montana, bowl-shaped valleys trap wildfire smoke from as far away as California, contributing to poor summer air quality. Wood smoke contains high levels of fine particulate matter (PM 2.5), which can cause many adverse health impacts. The American Lung Association ranked Missoula 10th worst out of 186 US cities in terms of number of days with high PM 2.5 concentrations, earning a grade of “F”. Many of the days with the worst air quality have occurred during summer wildfire season. With more fires burning in the western and central regions of Montana, we can expect more smoky days in the future, as seen in the maps below.
Fire Smoke Risk Index during fire seasons (May - October). Panel (a) is for present day (2004 - 2009) and panel (b) is for future (2046 - 2051) under climate change.
The map above can be found, along with more information about wildfire smoke and climate change in the report Air Pollution from Wildfires in the Western US under Climate Change by Liu et al.
The map above can be found, along with more information about wildfire smoke and climate change in the report Air Pollution from Wildfires in the Western US under Climate Change by Liu et al.
FUTURE TRENDS
No one can predict future climate impacts with complete certainty, but climate projections give us an idea of what to expect.
Look at the 2017 Montana Climate Assessment to find more about the information above.
- Over the next century, fire season is expected to get longer, and fire danger and drought are also expected to increase. "Smoke waves", defined as two or more days of unhealthy air, are likely to be longer, more intense, and more frequent.
- We are likely to see an increase in mean air temperature of between 2 and 5 degrees F over the next 20 to 30 years.
- In addition to hotter temperatures, we expect to see increases in winter precipitation, decreases in summer precipitation, and earlier and greater spring snowmelt, widening the gap between peak runoff and peak water demand, which fuels more intense wildfires by increasing spring vegetation that dries out by late-summer.
- Extreme heat days (90 degrees F and up) are projected to increase by 5-35 additional days by mid-century.
- Frost free days are expected to increase by 24-44 days by mid-century.
Look at the 2017 Montana Climate Assessment to find more about the information above.
|
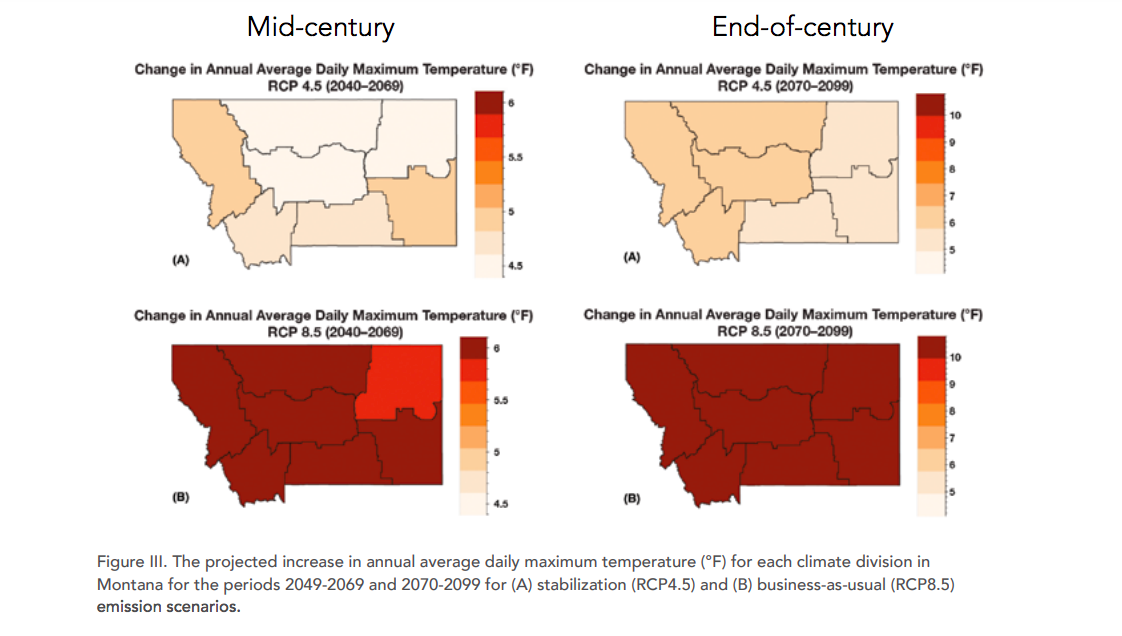
Under different emission scenarios, temperature projections vary. The graphic, right, compares the change in average maximum temperatures in the latter half of this century when emissions are stabilized versus continued business as usual. These projections predict increases of 5.6 to 9.8 degrees Fahrenheit. Imagine current summer temperatures, but 10 degrees hotter than the current average!
For more information about these emission scenarios, visit the Future Projections chapter of the Montana Climate Assessment. |
Source: 2017 Montana Climate Assessment
HEALTH IMPACTS OF WILDFIRE SMOKE: RESEARCH
|
Click on the links below for peer reviewed articles that focus on the human health impacts of wildfire smoke:
|
This page will continue to be updated with new science. We'll continue to add relevant, scientific information and graphics about climate change, wildfire smoke, and human health. If you know of resources that should be included, let us know.

